Worm with Glasses

Coding • DevOps • Personal

Jun 22, 2005

PICtach

Introduction

LED side of the pictach

In 2004 I finally had to purchase another car since my old boat (a 1980 Oldsmobile Cutlass Supreme) had finally bitten the dust. I looked around and found a 1997 manual 5-speed Chevy Cavalier. Great. It had been a while since I had driven a stick-shift, but I looked forward to it. One problem though: no tach. Now, I don’t actually need a tach to drive stick, but it’s sure nice to have. The project below was my attempt at building a tach for my car.

The project was never finished because in the fall of 2004 I rolled the car. (I survived without a scratch, but the car was totalled.) I did not finish the project because the replacement car already had a built in tach. The code to display the LEDs worked, so I got what I wanted out of the project.

Design

Schematic of the LED circuit board

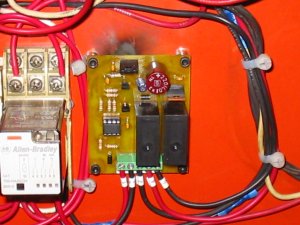
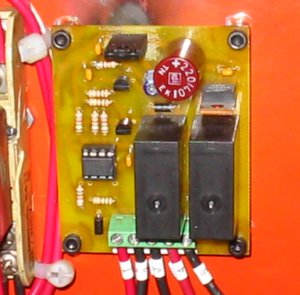
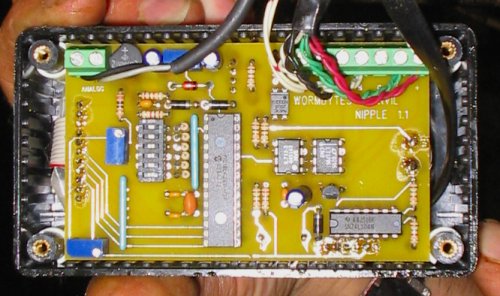
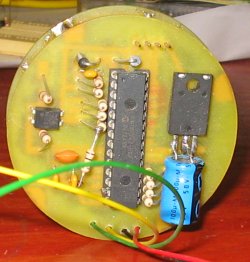
The heart of the pictach is the Microchip PIC18F242. I chose this controller because I had it laying around my work area. The PIC’s spec sheet states that it can sink (or source) 20mA per output pin. That is plenty to drive an LED; however, there are sixteen individual LEDs, plus the seven segments per numeric LED. Now the design decisions begin because first, the PIC doesn’t have that many output pins and second, even if the PIC had that many pins, there is no way it could source (or sink) that much current if all the LEDs were on! (The spec sheet states a total current draw of 300mA.)

Picture of the two halves of the PICtach joined together.

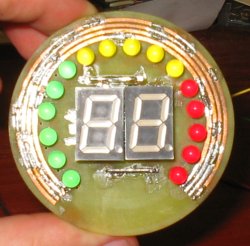
To keep the total current draw down, I decided to only illuminate one LED at a time plus one 7-segment LED. Therefore, the total current draw is under 100mA. By rapidly flashing the appropriate LEDs it creates the illusion that they all on at the same time. (Persistent of vision and all that jazz.)

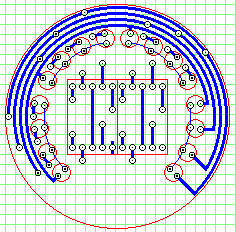
My other design decision was based on multiplexing the LEDs. My PIC did not have sixteen free outputs to drive the various LEDs. I separated the LEDs into four banks of four LEDs. Four output pins connected to the four banks as the return path. The other four output pins from the PIC were connected in parallel to the same LED in each bank. (The first LED in each bank had their anodes connected together.)

PIC side of the PICtach

To turn on an LED the anode for that position is brought high while the cathode for the bank is driven low. All the other cathode outputs are held high so only the selected LED position from the selected bank is on. Therefore, only eight outputs are needed to drive sixteen LEDs.

The two 7-segment numeric LEDs were wired in a similar manor. The seven segments are connected to seven outputs from the PIC, and each numeric LED has their cathode connected to two more outputs from the PIC. By driving the cathode of the appropriate numeric LED low I can select which numeric LED to display. They are alternated rapidly to give the impression that both were always on.

Firmware

The source code for the tach is written in assembly. This was one of first PIC projects I developed, so it shows the immaturity of my PIC coding style. I would do things differently if I was developing the code now. The pictach source code is released to the public under the GNU Public License.

Conclusion

Perhaps someday I’ll finish this project and package it into a device for a few of my friends. The basic idea works exceedingly well, and I’m pretty pleased with the design.

Jun 20, 2005

Battery Charging Monitor

Image of the battery charger monitor within the cabinet.

Introduction

A local manufacturing company contracted me to develop a battery charger monitor. Their forklifts are all battery operated, so they are constantly charging these batteries. Unfortunately, their existing battery charger did not include a means of monitoring the voltage going into the batteries, so they often overcharged and cooked the batteries. Not good. The device I developed monitors the battery’s voltage and when it reaches the “charged” limit automatically switches the charge into trickle charge mode.

There are two additional protections:

  1. The unit auto-starts at the presence of a battery. It waits an additional three seconds before starting the charger to ensure that battery is fully connected and that the operator has moved away from the contacts.
  2. Eight hours after the monitor is activated turn off all charging to the battery. This prevents the battery from being cooked by over-charging.

Hardware

Close-up of the battery charger monitor within the cabinet.

The hardware design is very simple. The controller is a Microchip PIC12F675. It monitors the voltage via it’s analog to digital converter. From there it drives two relays (via transistors) that control the full- and trickle-charges. A built in timer driven by the TMR0 interrupt keeps track of the seconds since activation.

The system is powered from the voltage charge on the battery (28V nominally.) The relays are driven from a 12V regulator, while the PIC is driven from a 5V regulator. The voltage across the battery goes through a resistor divider and then into the PIC’s input. The divider is to keep the input voltage below 5V. I also added a 5.1V zener diode to protect the input should one of the resistors fail.

An Aside about Voltage Regulators

I often need to use voltage regulators in my designs to produce the proper voltages for the micro-controllers. Often I have 24VDC present, but the PIC (or AVR) nominally need 5VDC. I’ve found that going from 24VDC to 5VDC through a regulator like the 7805 does not work very well. The 7805 becomes very hot and then goes into thermal shutdown.

Why does this happen? Ultimately a regulator works by internally dropping the difference between Vin and Vout. By looking at the 7805’s spec sheet you would think you could feed in a maximum of 30VDC while drawing 1.5A and produce a well regulated 5VDC out. If you try it you’ll find out what I did: that it doesn’t work, and you’ll burn your finger if you touch the regulator!

If you read the spec sheet further you’ll find that without a heat-sink a 7805 can dissipate around 6W (max!) at room temperature. Let’s do a little math here. Given:

V(in) = 24VDC
V(out) = 5VDC

The 7805 is, therefore, internally dropping:

V(drop) = V(in) - V(out)
        = 24VDC - 5VDC
        = 19VDC

Now, given the 7805’s power dissipation at room temperature is 6W, how much current can be drawn?

P(room) = 6W
V(drop) = 19VDC
I = P / V
I(max) = P(room) / V(drop)
       = 6W / 19VDC
       = 316mA

Last time I checked, 316mA is well below the 1.5A rating. Also, you’re at the absolute limit of the heat dissipation of the 7805, so you’re likely to toast it if you come anywhere close to drawing 300mA. Hence you either need a good heat-sink, or use some other means of dropping Vin.

Conclusion

Since I implemented and installed this battery charger monitor, the company has reported that they have not had any problems with overcharged batteries, and that their existing batteries are lasting longer. I consider that a success all around.

Jun 20, 2005

Machine Production Monitor

Photo of the production monitor mounted on the electrical cabinet.

Introduction

I was asked by a local manufacturing company to come in and help them retrieve production information from a department of nipple machines. The production information is gathered in real-time before being integrated into their existing AS/400 payroll system. Hardware wise, they needed twenty-four production monitors (one monitor for each machine) and one CAN-to-serial bridge for the central server. It was my job to design the hardware, program the firmware, and then write the code to aggregate the data before inclusion into the AS/400. Finally, I updated their COBOL payroll system to use the newly gathered data.

I had no idea what I was getting myself into when I started this project. I had only done personal projects involving embedded controllers, and I had no experience with the CAN protocol or LCDs. Finally, I had never worked with an AS/400 system, nor had I done any COBOL programming. All of this was new to me, but I agreed to do the project because the client needed the information to get a handle on production losses and I wanted a project to improve my programming and designing skills.

This was a multi-month project with a tonne of unique challenges. Below describes what I encountered and how I solved them. There are probably a few lessons in here for other people as well.

Requirements

The requirements for the project were as follows:

  • Display current cycle count and previous cycle count to the machine operator.
  • Store and report cycle information during power outages.
  • Bring production data from out in the plant into the office.
  • Integrate collected data into existing AS/400 payroll system.

Environment

Landis nipple machine

Each Landis nipple machine is attached to a Syntron vibratory feeder. This presents a unique challenge, since the Syntron works by chopping a three phase 600VAC signal. During half the cycle the bowl is pulling in and during the second half the spring is released. This chopping action produces a huge amount of electrical noise in the area around where the production monitor needs to operate.

In addition to the electrical noise produced by the Syntron, the Landis machines themselves have large electric motors which are under a varying load. Multiple times per shift the machines are turned on and off, so there are power spikes during power-up.

Because the Landis machines are threading steel, there is a tremendous amount of steel filings everywhere, and all the machines are operating with large amounts of oil covering every part of the machine.

Finally, the whole plant is a delta plant, meaning no common ground anywhere. Therefore, all the EMI generated by all the motors and wave chopping units has no path to ground, so it radiates in all directions. This plant is a nightmare to keep electronic devices working. There are professionally engineered PLCs that are constantly losing their firmware because of the amount of electrical noise in the environment. This was my biggest challenge in designing robust micro-controller monitoring units, and in networking these units to a central server located in the office.

Design Decisions

Inside of the production monitor showing the components.

I decided on using a Microchip PIC18F248 as the micro-controller for the production monitors because of it’s built-in CAN support. As mentioned, the operating environment is electrically noisy so I needed a network with a high common-noise rejection design. CAN looked like the best option, so I went with it.

With the micro-controller and network decision out of the way, I proceeded to design the motor load input system and the grip detection system. These Landis machines produce one part by threading one side of the part with one set of cutters, picking the part up, and then threading the rest of the part with a second set of cutters. Therefore, the client defined a “cycle” as a part moving through both cutters. This meant I had to track the status of both grips (which hold the part during the threading process.)

Fortunately, each Landis machine is controller by a small PLC, so I was able to tap into some of it’s outputs for tracking the grips, and to also know when the motor was running, and whether the Landis was in run-mode or manual-mode. Only run-mode cycles counted, so I had to know the difference.

To complete the data acquisition on the network I developed a CAN-to-serial bridge. It’s only roll is to listen for CAN messages on the network and to then translate them to a PC through the RS232 port. It also does the reverse (takes messages from the PC and places them on the network.) I designed the bridge hardware, wrote the firmware, and developed the interface code for the Linux PC that acted as the central data gathering and control point for the network.

The software on the PC was written in Perl and I utilized a PostgreSQL database to store and analyze the incoming data.

The last part of the project was the integration of this newly gathered data into their existing AS/400 COBOL based payroll system. Ultimately, it involved writing about 50 new lines of COBOL code in each of five applications. Finding what lines to add, and where to insert the new logic was a challenge since the majority of the code was not commented, variables were cryptically named, and the original author was no longer available to question.

Conclusion

The project took a lot longer than I had originally expected, but I learnt a tonne working through all the challenges. I now have a much better handle on hardened industrial design. I understand the CAN protocol much better, and how to work with LCDs. I have AS/400 experience (though I find it to be an odd platform) and I know how to program in COBOL (which I hope not to repeat.) All in all it was a fascinating journey.

I am also pleased to report that the customer is extremely happy with the results of the production monitors. They report that the material losses have dropped substantially since the monitors were installed.